4 App 2: Reactives
So we’ve connected our control up. Great! Now let’s add a numeric filter to our data by using an reactive. reactives are the heart and soul of shiny. We’ll use a reactive to filter our data, and pass this filtered data on to our two plots. This means we can dynamically filter our data and our plots will update.
A reactive can be thought of a bit of code that runs whenever the controls that map to it are changed. In this case, our reactive represents our filtered dataset when we adjust our slider.
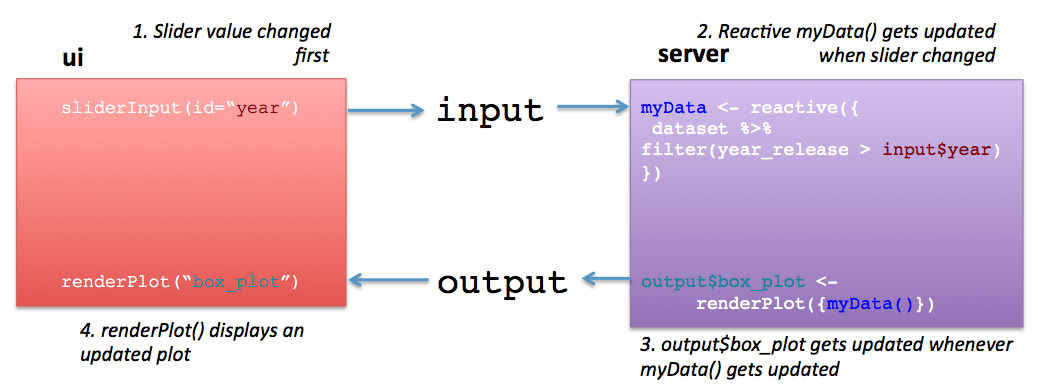
Basic workflow of reactives
4.1 Exercise
Open up the
02_reactivesfolder and theapp.Rfile within.Try running the app. You can see that we added a slider (using
sliderInput) inui, but it doesn’t do anything. We’re going to connect that slider to filter thebiopicsdataset.You might notice that there is a new object in the
servercode, calledbiopics_filtered. This is where we’re going to connect our slider.Paste the following bit of code into the reactive, after
biopics. What does it do?
%>% filter(year_release > input$year_filter)Notice how we call the reactive in
output$scatter_plot? We have to usebiopics_filtered()rather thanbiopics_filtered. A reactive is actually a function, and so you need to use the function notation to invoke it in arenderPlotstatement.Ok, run the app again and adjust the slider. Notice how the plot axes changes. Congrats, that’s your first use of a reactive!
4.2 For More Info
We’ve only shown one type of reactive, basically a reactive data.frame. Almost any type of object can be a reactive. Here are more resources on learning about them.
- Reactivity 101 (Dean Attali) - Dean Attali’s pages on Shiny are a good read, especially his section on reactives.
- Reactivity: An Overview (Official Shiny Documentation) - I personally find this overview of
reactives a little confusing.