3 App 1: Connecting ui and server
Basic shiny architecture
We’ll be taking two simple ggplot2 graphs and turning them into part of an interactive dashboard. The data we’re going to use is the biopics dataset from the fivethirtyeight package.
3.1 Making a ggplot interactive
The first visualization is a scatterplot visualizing the total box_office by year_release, colored by type_of_subject. For the interactive portion, we’re going to color each point by different categories. Notice we use aes_string() to map columns to aesthetics. This is important, since we’ll be passing character arguments to modify this plot later.
library(tidyverse)
library(fivethirtyeight)
data(biopics)

biopics %>% ggplot(aes_string(y="box_office", x="year_release", color = "type_of_subject")) +
        geom_point()
3.2 Exercise
Open the
01_app_basicsfolder and open theapp.Rfile. This is the file for the Shiny App and we’ll modify it.Look at the structure of the code. There are two objects that we define:
uiandserver. We make them into an app with the commandshinyApp(ui = ui, server = server).Take a look at the
servercode. Notice where ourggplot2code is. Both graphs are placed in arenderPlot()function, and we give them a place inoutput, souican “see” it. The scatterplot is namedoutput$scatter_plotand the boxplot is namedoutput$boxoffice_boxplot.Take a look at the
uicode. Where in the code are we displayingscatter_plotandboxoffice_boxplot? Notice we don’t need to refer tooutput. The display functionplotOutputknows to look in theoutputobject.Run the code by clicking the “Run App” button on the top of code window. You can see that we output our graphs in the “main” window.
Let’s paste in a control. Paste the following code where it says “Add User Interface Element here” in
app.R. If you run the app again, you should see a control, but it doesn’t change the plot.
selectInput("color_opts", "Select Category to Color With",
choices = select_color_options)- Let’s connect the control to the plot. Change the
coloraesthetic to the following:
color = input$color_optsNow try running the app. Your select box should control what categorical data controls the color of the points. Try it out!
Bonus! Let’s add in another category option. Where should you add it? Just in case, here are the column names and their data types. You probably shouldn’t add
title,director,subject,lead_actor_actresssince they aren’t really categories, and they will blow up yourggplots.
glimpse(biopics)## Observations: 761
## Variables: 14
## $ title <chr> "10 Rillington Place", "12 Years a Slave", ...
## $ site <chr> "tt0066730", "tt2024544", "tt1542344", "tt2...
## $ country <chr> "UK", "US/UK", "US/UK", "Canada", "US", "US...
## $ year_release <int> 1971, 2013, 2010, 2014, 1998, 2008, 2002, 2...
## $ box_office <dbl> NA, 5.67e+07, 1.83e+07, NA, 5.37e+05, 8.12e...
## $ director <chr> "Richard Fleischer", "Steve McQueen", "Dann...
## $ number_of_subjects <int> 1, 1, 1, 1, 1, 1, 1, 1, 1, 2, 2, 1, 3, 3, 3...
## $ subject <chr> "John Christie", "Solomon Northup", "Aron R...
## $ type_of_subject <chr> "Criminal", "Other", "Athlete", "Other", "O...
## $ race_known <chr> "Unknown", "Known", "Unknown", "Known", "Un...
## $ subject_race <chr> NA, "African American", NA, "White", NA, "A...
## $ person_of_color <lgl> FALSE, TRUE, FALSE, FALSE, FALSE, TRUE, FAL...
## $ subject_sex <chr> "Male", "Male", "Male", "Male", "Male", "Ma...
## $ lead_actor_actress <chr> "Richard Attenborough", "Chiwetel Ejiofor",...3.3 More about Inputs and Outputs
As you start to program Shiny apps, you’ll need to know the different kinds of inputs and the different kinds of outputs. This is a quick tour of the various types.
3.3.1 Interactive control tools (from UI to server)
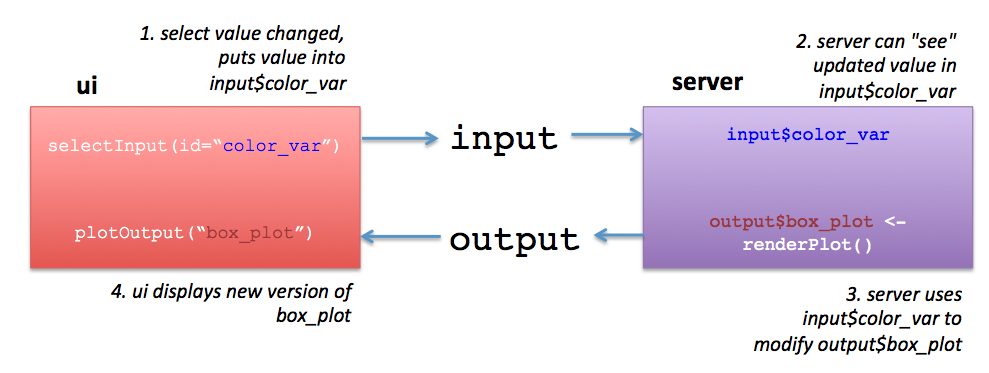
In the above image, the UI uses a function selectInput() to allow the user to interactively select the color variable. In the server, this selected color is called input$color_var.
This function selectInput() creates a box with choices for the user to select from. There are amny types of selecting tools, including drop down menus, checkboxes, radio buttons, numeric sliders, text input, etc. They all have their own function and they all require an argument id= which tells the server what the input is named.
A list of useful control functions can be found below (a more complete list with examples is in shiny.rstudio.com lesson 3):
| function | tool or widget description |
|---|---|
actionButton |
action button |
checkboxInput |
checkbox input, multiple options allowed |
fileInput |
file upload |
numericInput |
numeric value input |
radioButtons |
radio buttons where only one option is allowed |
selectInput |
a box that a user can type into and choose from choices |
sliderInput |
a slider bar |
textInput |
text/string input |
3.3.2 Display output (from server to UI)
In our above example, the server uses a function renderPlot() to send a boxplot image to the UI to display using the function plotOutput().
An example in the server function might be:
server <- function(input, output) {

  output$box_plot <- renderPlot({
    # R code goes here
    ggplot(iris, aes(y=Sepal.Length)) + geom_boxplot()
  })

}
Now, we’ve used ggplot() to make our boxplot, and renderPlot() assigns this plot to output$box_plot. The UI uses
plotOutput(outputId = "box_plot")which adds the plot stored in output$box_plot to the app.
There are many render* functions that are reactive functions producing reactive output. Remember, the server is where all the hard work goes. The UI just listens to what the server is giving it.
A list of render and output functions are found in shiny.rstudio.com lesson 4):
| render function | creates |
|---|---|
renderDataTable |
DataTable |
renderImage |
images (saved as a link to a source file) |
renderPlot |
plots |
renderPrint |
any printed output |
renderTable |
data frame, matrix, other table like structures |
renderText |
character strings |
renderUI |
a Shiny tag object or HTML |
Once the result is rendered, the UI takes this output and uses an *Output function to produce it in the app:
| output function | shows/creates |
|---|---|
dataTableOutput |
DataTable |
htmlOutput |
raw HTML |
imageOutput |
image |
plotOutput |
plot |
tableOutput |
table |
textOutput |
text |
uiOutput |
raw HTML |
verbatimTextOutput |
text |
Render functions take one argument (code) wrapped in ({}) such as
renderText({"Hello World"})Output functions take the name of the output object that is the result of a render* function.
3.4 What you’ve learned so far
- The architecture of shiny apps
- How
uiandservercommunicate throughoutputandinput - How
uidisplays plots (usingplotOutput) - Adding a control (a
selectInput) - Connecting that control to our
plotsusinginput
3.5 For More Info
Dean Attali is, next to Joe Cheng, a real Shiny expert and a great teacher. He has a great course on DataCamp called “Shiny Case Studies” that would be a great next step into learning more about Shiny.