Example Data Scavenger Hunt
Ted Laderas
January 11, 2019
Source:vignettes/data_scavenger_hunt.Rmd
data_scavenger_hunt.RmdWhat is a Data Scavenger Hunt?
A Data Scavenger Hunt is an activity that gets people to explore data. The burro app serves as a simple entry point to exploring the data.
There are multiple key elements of data scavenger hunts:
- Find a Dataset and build the app
- Have an overarching research question
- Have a set of increasingly complex questions about the data for people to answer
- Quick intro session
- Divide the participants into groups and assign questions
- Have recaps where participant groups show each other how they answered the question
We highly recommend having a Code of Conduct for these sessions.
Have a Dataset
This is the most important part!
Check out Building a burro app on how to build your app.
We’re going to use the NHANES (National Health and Nutrition Examination Survey) dataset package as our dataset. Check out the burro app here: http://tladeras.shinyapps.io/nhanes_explore
install.packages("NHANES")
Load it up and take a look at the documentation for this dataset:
Quick Intro Session
Divide the students up into groups of around 3-5 people. Each of the students should have a laptop, or they can share.
Give them a quick guided tour of the app, and give them a handout that maps types of questions to the different tabs/panels of the app.
Have a Research Question
The research question will focus the exploration of the data by deciding an outcome. For the NHANES data, we want to focus on Depression. In the NHANES dataset, Depression is represented as the Depressed variable.
So our research question is: “What are the potential covariates that are associated with Depression?”
Data Scavenger Hunt Questions
In designing the questions you will use in the scavenger hunt, you should do some prework and explore the dataset. This will inform your questions that you ask participants to look for.
Try and map the complexity of the questions to the three menu items: overview, categorical, continuous.
Overview type Questions
- How many subjects are there in the data?
- How many categorical (also known as factor) variables are there in the data?
- How is the
DepressedVariable defined? - When was the data collected?
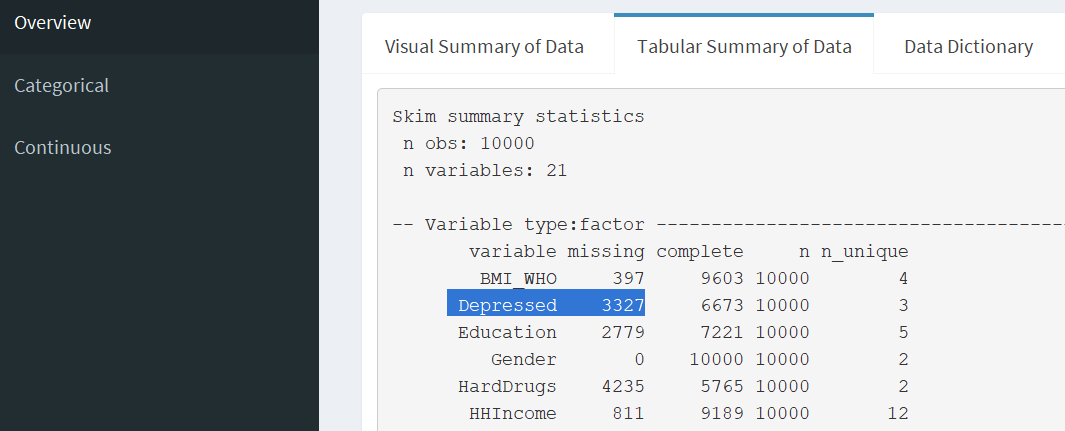
- How many missing values are there for the
Depressedvariable?
Category type questions
- How many missing values are there for
Depressed? - How many categories does
LittleInteresthave? What do they represent? - Is there an association of
LittleInterestwithDepressed? - Is marijuana use associated with depression?
Continuous type questions
- What is the oldest person in the dataset? Any idea why?
- How is sleep defined in the dataset?
- How are sleep and marijuana use related in the dataset?
- What is the most frequent number of sleep hours in the data?
- Is there a relationship between Sleep hours and depression?
- Is there a relationship between Sleep hours and Age?
Answering the Questions
Assign the questions to each group. Each group is responsible for talking the following:
- Where in the app did you answer your question?
- What variables did you look at to answer your question?
- What are your findings? Does the data conclusively answer your question?
Example answer for Categorical Question 1
Overall question: How many missing values are there for depressed?
- Where in the app did you answer your question?
Answer: Under Overview >> Tabluar summary of data, we can see the number of missing values for the Depressed variable.

- What variables did you look at to answer your question?
Answer: the Depressed variable.
- What are your findings?
Answer: there are 3327 patients with missing information.
Discussion
Be flexible. You might not get through all of the questions. If a finding is interesting, discuss it more. Is there other evidence supporting a finding? Is it what you expected, or is it surprising?
How was the data collected? How does the data collection affect the structure of the data?